
To say that the 2016 NFL regular season was memorable could be an understatement.
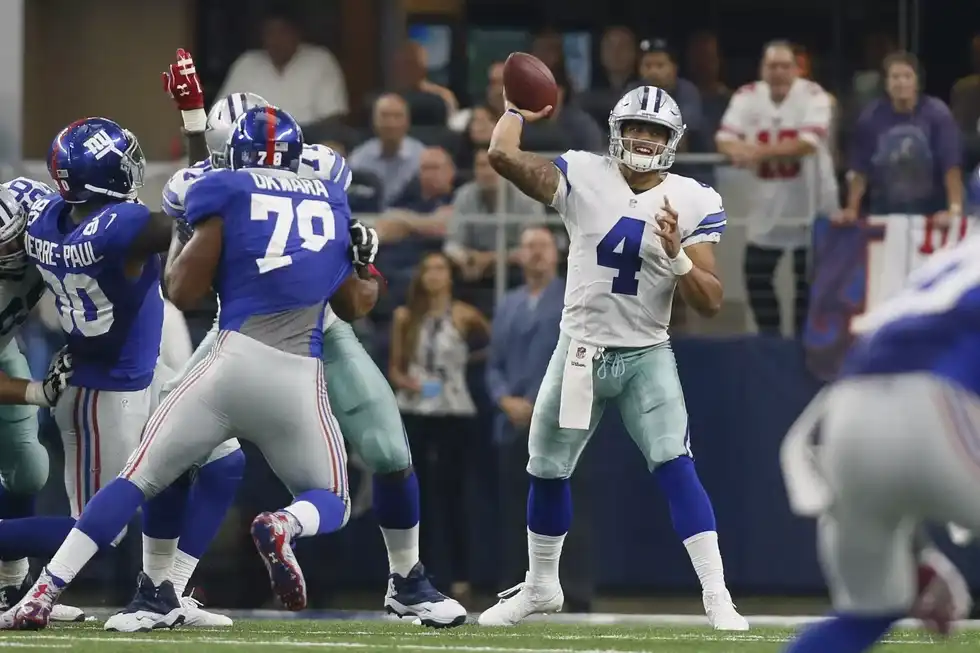
A year filled with suspensions, controversies, record-breaking moments, and memorable losing streaks couldn't say more. But if there's one storyline that embodied the 2016 regular season, it was the MVP-caliber play of a pair of Dallas Cowboy rookies, Dak Prescott and Ezekiel Elliot.
These teammates arguably had the greatest rookie campaigns in NFL history, but do the stats back that up?
Approximate Value
Sports such as baseball, hockey, and basketball apply a system like Wins Above Replacement (WAR), and a plus-minus system that measures a player's value to their team. Football being the odd one out lacks such a method that tracks a player's value. This makes the task of measuring a football player's value daunting. To remedy this issue the founder of the pro-football-reference website, Doug Drinen, a mathematics professor at Sewanee University, developed the Approximate Value (AV).
Detailed in the site's blog post "the Approximate Value (AV) method is an attempt to put a single number on the seasonal value of a player at any position from any year."
Professor Drinen explains that this method "is not meant to be a be-all end-all metric." Football stat lines are just not capable of measuring all of the additions a player may have in ways that baseball and basketball do. It's also important to remember that a player with an AV of 16 and the other with 14 doesn't automatically mean that the higher AV player is better or had a better season. This small error is commonly found in the plus-minus system and WAR.
"Essentially, AV is a substitute for --- and a significant improvement upon, in my opinion --- metrics like 'number of seasons as a starter' or 'number of times making the pro bowl' or the like," Drinen said. "...'number of seasons as a starter' is a reasonable starting point if you're trying to measure, say, how good a particular draft class is, or what kind of player you can expect to get with the #13 pick in the draft. But obviously, some starters are better than others. Starters on good teams are, as a group, better than starters on bad teams."
The metrics used to gather the data is rather lengthy, so here is the best-simplified version.
Offensive points per estimated drive (OPPED) takes rushing touchdowns, passing touchdowns, field goal attempts, punts, and turnovers into consideration. OPPED = ( 7*TDs + 3*(field goals made) ) / ( TDs + FG attempts + punts + turnovers ). The team's OPPED by the league OPPED, multiply by 100. The points are then distributed among the offense based on a percentage by position. A similar approach is used for defense. (Explanation by Doug Drinen)
A method like this could help accurately measure and project the value of player throughout his career.
Tracking NFL Rookies Values
Taking the Approximate Value (AV) into consideration, the 2016 season was a great year. Matt Ryan, the winner of the 2016 MVP award, led the NFL in Approximate Value (AV) with 21 in 2016, followed by Damon Harrison 18 and Aaron Rodgers 18. Ezekiel Elliot peaked at ninth with 16 along with his teammate Dak Prescott's finishing 15th.
Among their fellow rookies, Elliot and Prescott led at first and second with Tennessee Titan Jack Conklin at third. The average rookie AV within the top 100 was five, and 11 within the top 10. Three rookies ranked in the top 100 of the overall leaderboard 2016.
Still, how does this year's crop of rookies stack up to prior draft classes? Looking at acquired data as far back as 2010 you can see how the rookie Approximate Value (AV) has progressed.
Since 2010, the average rookie Approximate Value (AV) of the top 100 rookies is five, and the average of the top 10 is 10.6. The 2010 season is the weakest classes with and the average of 4.6 in the top 100 and 9.9 in the top 10. The rookie Approximate Value (AV) peaked the subsequent year in 2011 at 5.45 in the top 100 and 12.3 in the top 10. Rookie AV has virtually plateaued since with not major increase.
As far as rookies placing in the overall AV top 100 leaderboards, 2011 saw the most placements with six rookies followed by five in 2012 and four in 2014.t
Accuracy
In order to validate a new method like Approximate Value, its accuracy is key for its legitimacy. Based on the collected data from 2010-present, Professor Drinen's method holds up.
Of the 70 top rookies, within the top 10, from 2010-present 23 of them were selected for the Pro-Bowl their rookie season. Eight of those rookies, including Odell Beckham Jr., Aaron Donald, Russell Wilson, Andrew Luck, Patrick Peterson, Cam Newton, A.J. Green, and Ndamukong Suh, went on to be selected for multiple pro-bowls.
The Verdict
By using data from 2010-present one could make the argument that this method of evaluating player value is accurate. While this sample size is small, consideration for the NFL to adopt this system or one similar to this should be high. While football may be the most popular sport in America they are likely behind in the business of analytics. One can only hope that the NFL takes initiative and researches into adapting such a system.