

The view on marriage in the past ten years has shifted, and generations are beginning to take a different stance on it. Millennials are now waiting until their late 20s to start getting married, while ten years ago, couples began to get married in their early 20s. Couples are also dating for at least 4.9 years before getting married. All of these changes in the culture are visible on divorce and marriage data, visible changes from the past two decades show that divorce rates are down, even though the amount of marriages has not decreased a whole lot.
How Have Times Changed?
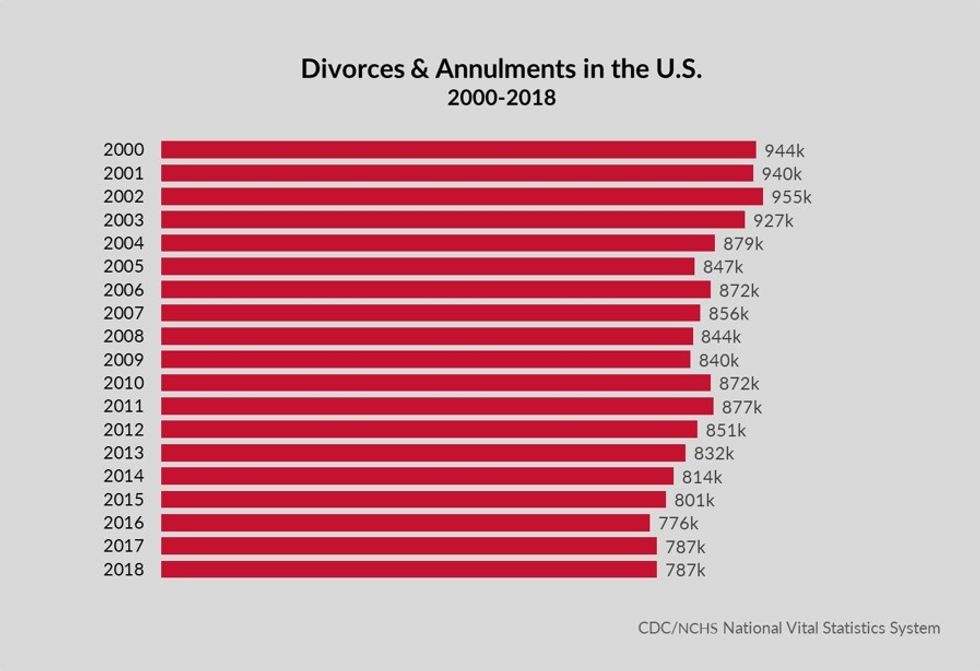
The Center for Disease Control and Prevention has recorded the number of divorces and annulments in the United States for the past 18 years. On the chart below done by the Pennsylvania family law firm Ciccarelli Law Offices, you can see the total from the year 2000 to 2018. It must be noted that this chart excludes data from California, Hawaii, Indiana, and Minnesota. Here is the biggest takeaway from these statistics.
- 2002 had the highest amount of divorce and annulments with 955,000
- 2016 had the lowest amount of divorce and annulments with 776,000
- Divorce rates have decreased in the past 18 years by 155,000 divorces and annulments.
 Ciccarelli Law Offices
It's clear that the rates of divorce have significantly dropped since the new millennium, but what can we attribute to these changes? Could it be because people are getting married later in life, and therefore divorce at a smaller rate? Or could it because fewer people are getting married. Taking look at the number of marriages per year, we may get a clearer view of why these rates have changed over time. In 2018 there were 2.1 Million marriages in the United States, while in 2000 there were 2.3 Million marriages. It's also important to note the population in each year, 2018 population was 327 Million people while in 2000 the population was 281 Million. The difference in population is by a lot, however, there's only a 1% difference in marriages between 2018 and 2000.
Why Are Younger Generations Not Getting Married?
According to a Time article, new generations are not only getting married later but some communities, for example, young people who live in poorer neighborhoods, are opting to cohabitate and never get married. Many are still having kids, but no marriage. Meanwhile, people with more money get a higher education, delaying when they get married and also taking marriage off the table completely because both partners are successful and more educated. Twenty years ago, it was more common for one person to be the only one with a full-time job, however, 20 years ago it was cheaper to maintain a one-income household.
What state has the Highest Divorce Rate?
According to the CDC, Nevada has had the highest divorce rate since 1990. Statistics show, in 1990 the states' divorce rate was 11.4, the state closest to having that high of a rate was California with a 6.9. Fast forward to 2018, the divorce rate is still the highest with 4.4, It has decreased since the 90s but remains high compared to the rest of the states. Not only does Nevada have the highest divorce rate in the past 30years but it also had the highest marriage rates. Back in 1990 the marriage rate was 99. You can correlate this to the fast-moving marriage trend at the Las Vegas strip and its infamy for speedy and inebriated marriages.
Overall, the number of couples getting married has not decreased by a large number, but divorce rates have. It's difficult to pinpoint at one reason why that is the case, but with new generations to come and a shaky economy, it is hard to know what we can expect in the next ten years.


 people sitting on chair in front of computer


 all stars lol GIF by Lifetime
 two women talking while looking at laptop computerPhoto by
  shallow focus photography of two boys doing wacky facesPhoto by
  happy birthday balloons with happy birthday textPhoto by
  itty-bitty living space." | The Genie shows Aladdin how… | Flickr
 shallow focus photography of dog and catPhoto by
  yellow Volkswagen van on roadPhoto by
  orange i have a crush on you neon light signagePhoto by
  5 Tattoos Artist That Will Make You Want A Tattoo
 woman biting pencil while sitting on chair in front of computer during daytimePhoto by
  a scrabbled wooden block spelling the word prizePhoto by
 StableDiffusion
 StableDiffusion
 StableDiffusion

 women sitting on rock near body of waterPhoto by
 Photo by
  Photo by
  Photo by
  Photo by
  Photo by
  Photo by
  Photo by
  Photo by
  Photo by
  Photo by


