

Infographics are on the up and coming for more reasons than one. First, it’s much more enjoyable to look at images and graphics rather than reading text. Second, visual content is easier for our brains to process. According to HubSpot, an infographic is 30 times more likely to be read than a text article (somewhat ironic if you're reading this).
Infographics are easy to create, even if you don’t have a single creative bone in your body. Here are five simple steps in creating an infographic:
- Pick a topic you want to represent visually.
- Gather your data.
- Make a wireframe.
- Utilize free assets.
- Lay the data out visually
Step 1: Pick a Topic
My senior year in college, we were tasked with creating an integrated campaign for a local non-profit. This involved four months of research, which at the end of the semester, would be presented to the client. Instead of creating a bland and wordy PowerPoint, we came up with the idea of visually representing our data.
The non-profit we chose was Woldumar Nature Center in Lansing, Michigan.
Step 2: Gather Data
This is oftentimes the hardest part. When you’re in the process of collecting data, you want to think about how it could be represented visually. Is the data quantitative or qualitative? It’s OK to include qualitative data in infographics, but it’s much easier to utilize data that can be expressed in numbers.
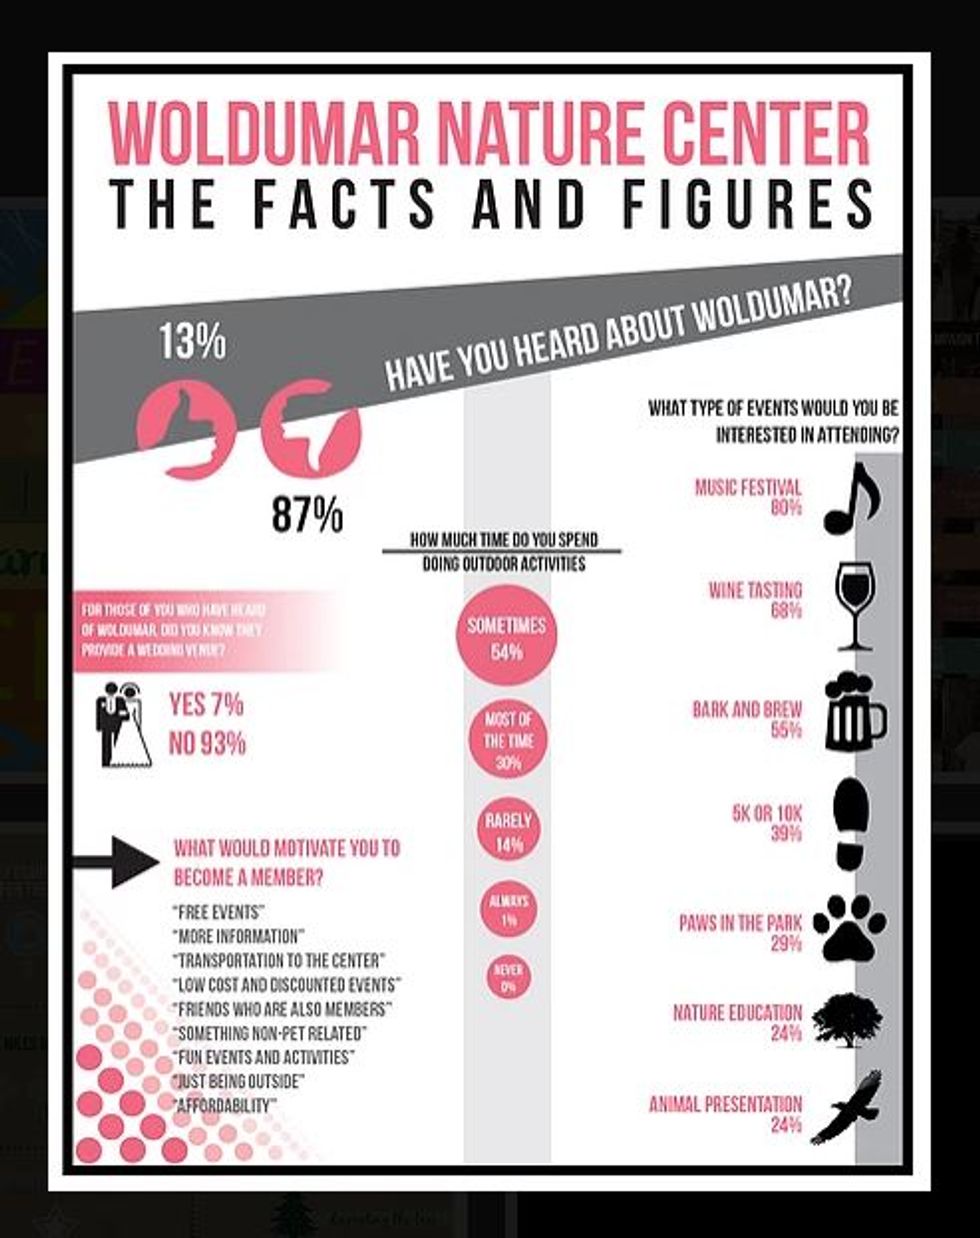
For example, the data we collected involved asking the sample population if they were familiar with the non-profit, how much time they spent outdoors and what events they would be interested in attending.
Sample Data:
- 13% were familiar with Woldumar, 87% were not
- 54% sometimes outside, 30% most of the time outside, 14% rarely outside, 1% always outside, 0% never outside
- 80% music festival, 68% wine tasting, 55% bark and brew, 39% 5K or 10K, 29% paws in the park, 24% nature education, 24% animal presentation
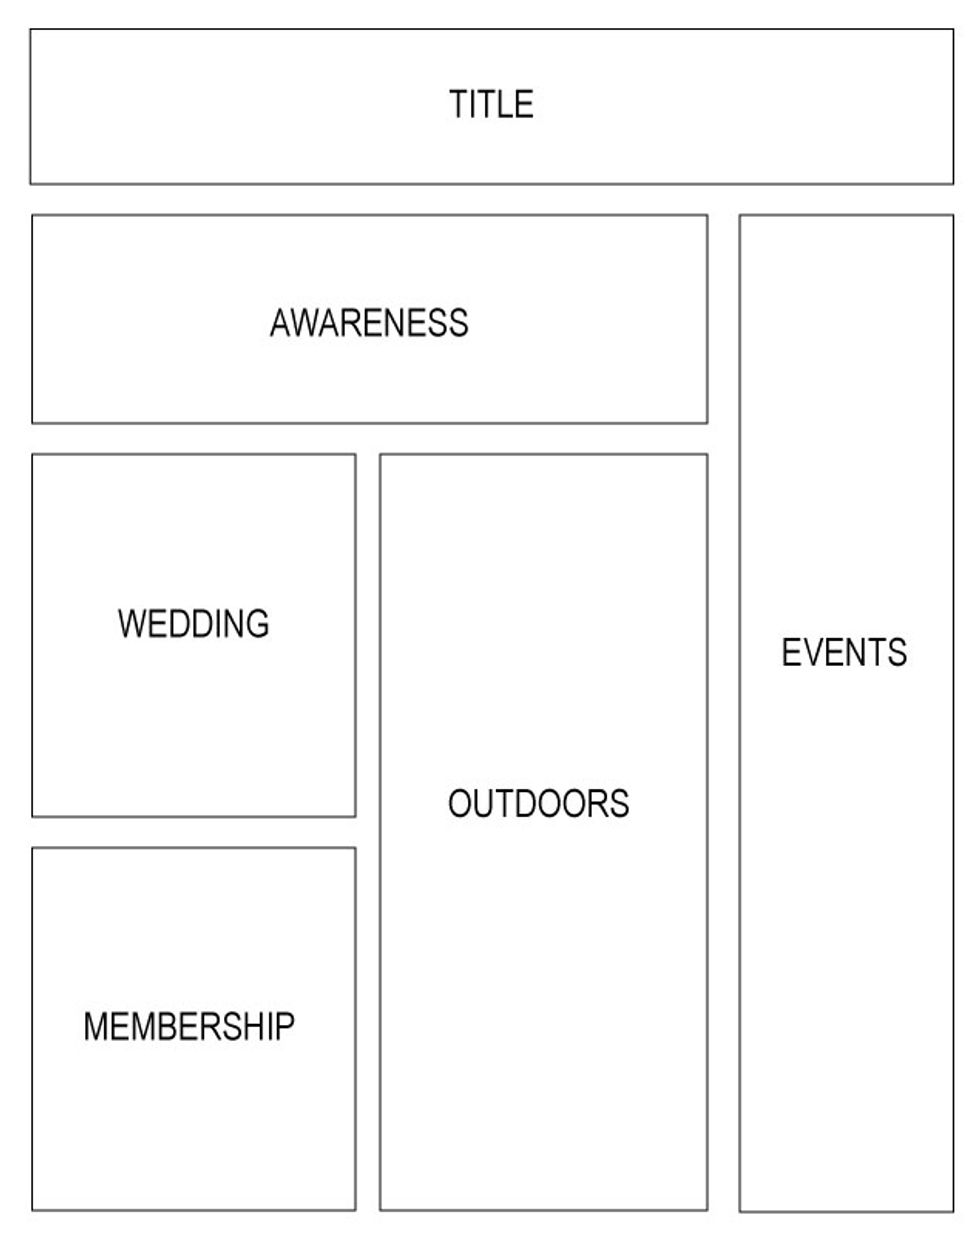
Step 3: Make a Wireframe
Making a wireframe is as simple as drawing boxes on a sheet of paper. Think about how you want to layout the data you collected. What information goes with what? Can icons be used? Will you need a lot of space for text?
Step 4: Utilize Free Assets
There are TONS of free assets you can utilize when creating infographics, which is why you don’t need to be creative…other people do it for you.
Here are a few of my favorites:
- Backgrounds and Graphics:www.freepik.com
- Icons: www.iconfinder.com
- Stock Photos: www.unsplash.com
- Layout: www.canva.com
Step 5: Layout (www.canva.com, www.piktochart.com)
Create a free login and start laying out your data, based on what you drew in your wireframe. Choose the category “Infographic” and start building using a template, or start from scratch. You can search for backgrounds and imagery, add elements, and experiment with different fonts. When you’re done with your infographic, you can export it in a variety of different formats.
If you have experience with Adobe Illustrator, you can use Canva and Piktochart for ideas. Start with a white artboard and play around with your data and visuals.
There you have it! A visual representation of data that is much more interesting to see than read.