

Determination of Unknown Phosphorus Concentration Through a Calibration Curve and Colorimetric Analysis
Abstract
Calibration curves are one of the most ubiquitous and essential procedures in analytical chemistry. This experiment used a phosphorus stock solution of known concentration to make a series of calibration standards. The absorbances of these standards were then measured to create a calibration curve. The absorbances of two solutions of unknown concentration were then measured. The concentration of these solutions were found to be 13±1 and 8±1. These values met with expected values of concentration for the unknown solutions.
Introduction
The importance of determining the concentration of phosphorus (in phosphates of many forms—ortho, organic, poly) is mainly environmental—phosphate pollution remains a major problem due to its overuse in detergents and large-scale fertilizer; the subsequent runoff of phosphates into the environment can cause significant harm to plants and animals (Lim). The EPA maintains the practice of water testing for levels of phosphate in drinking water as well (EPA). The main method utilized for quantitative phosphate analysis is through solution spectrophotometry, which is what is used in this experiment. Also utilized is the practice of producing a calibration curve.
Calibration is incredibly essential to practically all aspects in analytical chemistry. Without a sense of calibration, measurements have no meaning in relation to one another. Thus, the concept of the calibration curve is created. The basic theory behind the calibration curve is that if there exists a series of known values (eg concentration) and their resulting measurements (eg absorbance), the values of the measurements of unknowns can be calculated. For example, this experiment makes use of a series of phosphorus standard solutions with known concentrations and their resulting absorbances (measured by a spectrophotometer) to create an equation for a line of concentration vs. absorbance. This equation is then used to calculate the concentration of an unknown phosphorus solution. The overall grand purpose of the calibration curve is to determine the unknown based on what is known.
Spectrophotometry remains a relatively fast, accurate method of calculating the concentration of substances in solution by way of measuring their absorbance at specific wavelengths. Based on their absorbance, the absorbances can either be plotted versus a series of known concentrations and produce a calibration curve to produce a linear equation to determine unknown concentrations, or Beer’s Law can be utilized instead. A calibration curve and its subsequent linear equation is used in this experiment.
This experiment relies on the usage of a spectrophotometer to measure the concentration of the phosphorus in various solutions after reaction with Reagent C. The intensity of the color [and thus the absorbance] will be in direct proportion with the concentration of phosphorus in this sample (Lim). The spectrophotometer is used to measure all of the absorbances for the solutions.
Purpose
The purpose of this experiment is to gain practice in the creation of calibration curves and their application (to use them to calculate unknown values from their measurements, based on known values and their respective measurements). The specific calibration curve created for this experiment is concentration of phosphorus vs. absorbance. The application of the calibration curve in this specific instance is to find the concentration of phosphorus in two unknown samples based on their absorbances and the calibration curve. The creation of the calibration curve also gives practice in the technique of creating a series of standards.
Experimental
The procedure described in this section is from the Agilent Method 1 procedure in the paper that was given to the class by the instructor; all credit for the ideation of the following procedure should be given to Sharon Lim of Agilent Technologies, Inc. It should also be noted that only the procedure for preparation of the calibration standards and unknowns was followed - all other parts of the procedure were handled by the instructor/TA (eg stock preparation, preparation of reagents, etc). For preparation of the calibration standards, the stock phosphorus solution was at the concentration of 50ug P/mL solution. Reagent C is an ammonium molydate/ammonium metavanadate solution that reacts in the presence of phosphorus to give a yellow color; the higher the phosphorus concentration, the darker the color of the resulting solution.
For the first part of this experiment, five calibration standards were mixed. Every standard contained 10mL of Reagent C, varying amounts of stock, and enough water to dilute the solution to 50mL. Solution 1 contained only Reagent C and 40mL of water. Solution 2 was mixed with 10mL Reagent C, 5mL of stock, and 35mL water. Solution 3 contained 10mL Reagent C, 15mL stock, and 25mL water. Solution 4 was made with 10mL Reagent C, 25mL stock, and 15mL water. Solution 5 was mixed with 10mL Reagent C, 35mL stock, and 5mL water.
After preparing the calibration standard solutions, the absorbances of each solution were read. The spectrophotometer used was a Cary 1 spectrophotometer with a 1 second signal averaging time. The wavelength used was 470nm. The absorbances were taken in triplicate for each solution. These absorbances were then averaged and plotted to form a calibration curve. A standard deviation of the absorbances was also calculated.
Next solutions of unknown were made. Unknowns A and C were measured. The solutions were made in duplicate. The solutions contained 10mL of Reagent C, 35mL of the unknown (either A or C), and then diluted to 100mL with deionized water. After preparation of the samples, the absorbances were taken. The absorbances were measured in triplicate, and an average value was calculated. A standard deviation of the absorbance values was also calculated. This data was then used to calculate the concentration of the unknowns, which was also averaged.
Data
Table 1 - Concentration of Calibration Standards
Calibration Standard Solution | Concentration (mg P/L) |
Solution 1 | 0 |
Solution 2 | 5 |
Solution 3 | 15 |
Solution 4 | 25 |
Solution 5 | 35 |
Table 2 - Absorbance Values for Calibration Standards
Standard | Concentration (mg P/L) | Absorbance 1 | Absorbance 2 | Absorbance 3 | Average Absorbance | Standard Deviation |
1 | 0.0 | .15 ± .01 | .15±.01 | .15±.01 | .15±.02 | 0 |
2 | 5.0±.2 | .28±.006 | .29±.006 | .28±.006 | .28±.01 | .006 |
3 | 15.0±.3 | .56±.01 | .54±.01 | .55±.01 | .55±.02 | .01 |
4 | 25.0±.2 | .63±.01 | .63±.01 | .63±.01 | .63±.02 | 0 |
5 | 35.0±.3 | .79±.006 | .80±.006 | .80±.006 | .80±.01 | .006 |
Graph 1
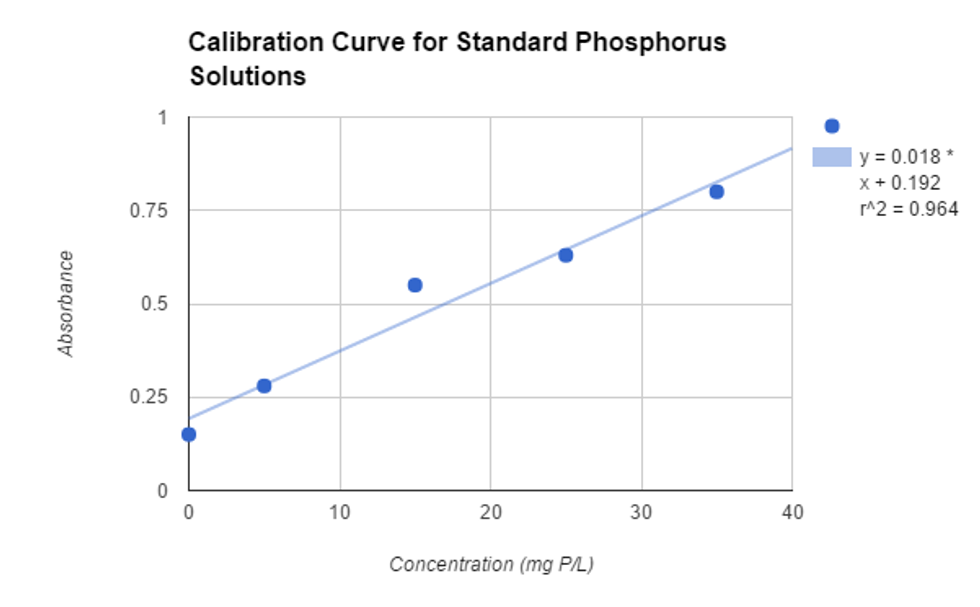
Equation of the line for absorbance → Absorbance=.018*Concentration + .192
Table 3 - Unknown Sample Absorbances
Unknown | Absorbance 1 | Absorbance 2 | Absorbance 3 | Average Absorbance | Standard deviation | Concentration (mg P/L) | Average concentration |
Unknown A, test 1 | .30±.006 | .30±.006 | .31±.006 | .30±.01 | .006 | 12±1 | xxx |
Unknown A, test 2 | .31±.01 | .31±.01 | .31±.01 | .31±.02 | 0 | 13±1 | For A 13±1 |
Unknown C, test 1 | .26±.01 | .26±.01 | .26±.01 | .26±.02 | 0 | 8±1 | xxx |
Unknown C, test 2 | .26±.006 | .27±.006 | .27±.006 | .27±.01 | .006 | 8±1 | For C 8±1 |
Sample Calculation of Absorbance
A = .018*concentration + .192
A - .192 = .018*concentration
Concentration = (A-.192)/.018
Concentration = (.30-.192)/.018 = 6.1 mg P/L
Because the calibration standards were made at 50mL total volume and our unknown samples were made to be 100mL total volume, the actual concentration of the unknowns is twice as high as the value calculated here.
When plugged back into the equation for absorbance, their absorbance values fall within the expected theoretical range for their true concentrations.
Sample Calculation of Error in Absorbance
5% error is assumed in the slope of the line and the y-intercept
.30±.01 - .192±.0096 = .11± (.01^2 + .0096^2)^½ = .11±.01
.11±.01/.018±.001 = 6.1 ± [6.1*(.01^2/.11^2 + .0009^2/.018^2)^1/2] = 6.1 ± .6 mg P/L
Discussion
The results given for the unknown concentrations were very close to the values that would theoretically be expected; that is, the expected values for the concentrations based on their absorbances make sense when plotted on the graph of the calibration curve. The measured absorbance for Unknown A (calculated concentration 6±1mg P/L) is slightly higher than the measured absorbance of the standard of concentration 5mg P/L. After correcting for the 2x dilution factor used in the unknown samples, the calculated concentration becomes 12±1mg P/L; the calculated theoretical absorbance (.41) for this value is slightly higher than the theoretical absorbance of a solution of 10mg P/L (.37). The same type of comparisons hold true for the Unknown C; the measured absorbance (.27±.01) is slightly lower than the average absorbance value for the 5 mg P/L standard (.28±.01) This is to be expected as the concentration of Unknown C is calculated to be 4±1 mg P/L before the correction of the 2x dilution factor. After correction for the 2x dilution, the concentration of Unknown C is calculated to be 8±1 mg P/L. The calculated absorbance for this concentration (.34) falls slightly lower than the theoretical absorbance for a standard of 10mg P/L (.37) as would be expected.
A possible source of error results from the two differing volumes of solution made; when mixing the calibration standards, the varying volumes of stock and 10mL Reagent C were mixed, then diluted to 50mL with deionized water. However, when the unknown solutions were being mixed, they had 35mL of stock, 10mL Reagent C, and were diluted to 100mL with deionized water. This means that the unknown solutions were diluted twice as much as the calibration standards. This had to be accounted for by multiplying the concentration calculated from the data by 2; this gave the actual concentration of the unknown solutions. As mentioned in the previous paragraph, the values calculated from either unknown still matched with theoretical and measured values of concentration and absorbance; thus the effect of the 2x differing dilutions on the validity of the results appears to be negligible, but it is possible it contributed to overall error in the experiment. In the future when performing this experiment, specificity on the volumes of the standards and samples could prove very beneficial; in addition, dictating that all solutions be diluted to 100mL could prove useful as well - 50mL volumetric flasks were not present in the equipment drawers I had available to me while performing the experiment.
Two samples of each unknown were prepared; three absorbances were read from each sample. Obviously, multiple measurements are taken from each sample in an effort to lower the percent difference from the accepted values. As in all experiments, here it is essential that the measurements agree; if there were to be significant difference then there is most likely a significant amount of systematic error present in all measurements in the experiment. Because the average of the absorbances agreed (within ±.01 of each other for each unknown’s samples), the possibility of systematic error in the measurements of the absorbance can be eradicated almost entirely; this means that basically only random error is left in absorbance measurements, which contribute a far smaller amount of error to the result than systematic error could.
In comparison to Beer’s Law ( A=ɛ *c * l ), the results are probably less accurate than what would have been given through the use of Beer’s Law; the reasoning behind this is Beer’s Law is an actual scientific law as opposed to a linear regression plotted from 5 data points. However, while more accurate, Beer’s Law is also somewhat more difficult to use; it requires knowledge of the molar absorptivity constant ɛ, which is specific to a substance and must be calculated for every new wavelength used in the spectrophotometer. It also does not allow for a blank to be put through that contains Reagent C (specifically for this reaction), as any absorbance would be attributed to the substance in question; the lack of Reagent C in the blank would distort the data, giving an absorbance of ~0 with no phosphorus in the solution. Clearly this is false, as Reagent C will contribute to the absorption of the solution. Finally, Beer’s Law requires calculations to be done in moles (ɛ is the molar absorptivity, after all), which can be quite error-inducing to calculate when concentrations would otherwise be measured in mg/L. Because of these reasons a simple linear model (as used above) is a far easier and almost as reliable method for determining concentrations.
The Agilent method brings forth a concentration for the phosphate solution that does not come with justification. The following calculations are able to show how the starting mass of material came to the end concentration. 22.068mg KH2PO4 was dissolved in distilled water and diluted to 100mL for a final concentration of 50.3ug/mL
22.068mg KH2PO4 = 22068ug KH2PO4
22068ug / 503ug/mL = 43.9mL water
Perform a 1:10 dilution → 10mL of this solution in 90mL water
503ug/mL *1/10 dilution = 50.3ug PO43--P/mL
PO43--P refers to the amount of phosphorus present in the form of phosphates
In a comparison of the EPA standard method to the Agilent method, a significant difference can be found in that the EPA method tests only for the presence of orthophosphates. If analysis of other types of phosphate is desired as well, the other types of phosphorus compounds present (organic phosphates, polyphosphates) must be converted to orthophosphates. In comparison, the Agilent procedure tests for the presence of any phosphorus present in a phosphate compound. In addition, the type of colorimetric tests vary; Agilent uses a vanadomolybdophosphoric acid method to determine total phosphorus concentration, while the EPA uses a solution of ammonium molybdate and antimony potassium tartrate to find orthophosphates. Noteworthy as well was the much lower concentration range of the EPA test; the EPA test was usable in the .1-.5mg P/L range while the Agilent test never specified a limit on concentration of phosphorus in the sample; the Agilent method worked very well with a much higher concentration of phosphorus in the sample in this experiment. The EPA test also includes error analysis in their calculations and procedure; Agilent does not propagate the error for any calculations. The EPA method also accounts for insoluble phosphorus if the amount of undissolved phosphorus is great enough. Overall, while both tests follow the same basic methodology, the EPA test seems much more thorough, involved, and precise and accurate than the Agilent method, which seems to be a kind of quicker and more efficient method while still maintaining a fairly high amount of accuracy in the determination of phosphorus concentration.
References
Lim, S. (2011). Determination of phosphorus concentration in hydroponics solution.
Water.epa.gov. Environmental Protection Agency, 1978. Web. 16 Sept. 2015.