

Hello young investors! Today I will be going over Yahoo Finance this is a great tool to use in conjunction with Robinhood. It allows you to keep up with news that will directly affect stocks and ETFs. This article will read something like a fact sheet, so feel free to refer back to this whenever you are wondering about a specific statistic.
Yahoo Finance is a great resource because it is very simple and easy to use. It will give you the tools you need in order to invest. You should check it on a weekly basis at least. This will keep you updated on trends happening in the marketplace and which stocks to invest in. The most helpful tools are available to look at individual stocks, for this we will look at one stock for example; Best Buy.
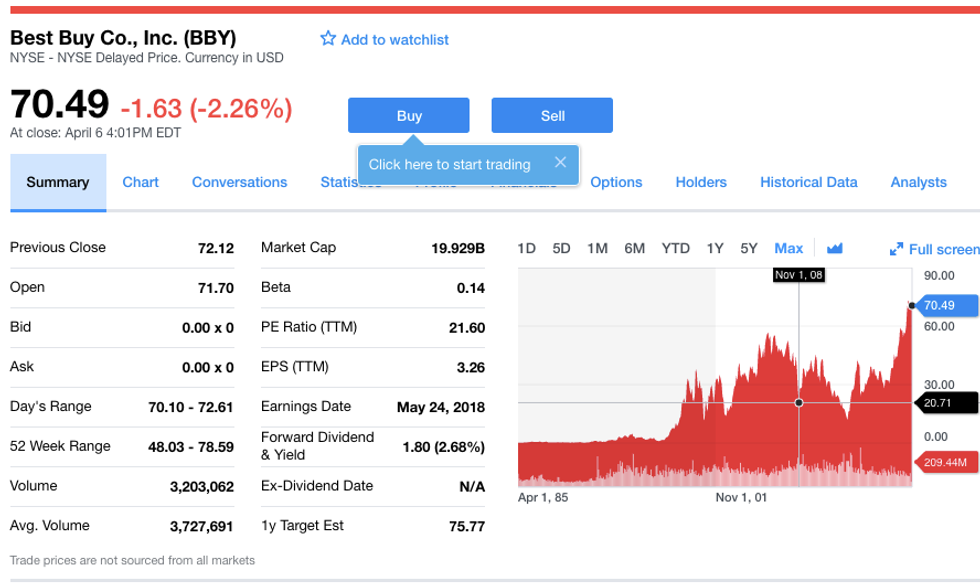
Here you can see all the different factors that will tell you if this is a stock you should buy. Now don’t let all the numbers scare you, each one is simple to understand:
- Previous close: this is the price of the stock when the market closed at the end of the previous period.
- Open: This is the price which the stock opened at for the previous day.
- Day’s range: this displays the highest and lowest prices the stock was sold at for the previous trading day.
- 52 week range: this is similar to the day’s range. It show you what the highs and lows were over the last 52 weeks/1 year
- Volume and and average volume: This shows the quantity of stocks that are traded on a daily basis and on average.
- Market Cap: This is the total value of all of the stocks the company has on the market.
- Beta: This shows how volatile the stock is compared to the market. The closer the beta is to one the better it mimics the movement of the market, growth or loss.
- Price to Earnings Ratio: This is the price of the stock per every one dollar of earnings that the company makes.
- Earnings Per Share: This tells you the profit per every outstanding share
- Forward Dividend and yield: This tells you the estimation of the year’s dividend and the yield shows how much a company pays in dividends as a percentage of stock price.
- 1y Target Estimate: This is an analysts estimate of what the stock should cost in 1 year.
So looking at these in conjunction with Best Buy, I would probably say to hold off on buying. Their earnings per share is a little low while the price to earnings ratio is a little high. Right now they are near the highest their stock has ever been. So I would likely think their stock is going to take a hit in the near future, that would be the time to buy. Looking at outside factors, the retail industry is in trouble so I would not count on a business like Best Buy in the long-term. This analysis is just part of the fun of investing. What do you think will happen? There are tons of articles on the company and how they are doing that will help you to make better decisions. Good luck!